Visualization Pages
The application presents 5 major pages that can be navigated by a user upon successful authentication. These include:
Overview/Dashboard
HIV Care & Treatment
Prevention & Testing
Quality Care Activities
Wellness Centres
The pages listed above provide meaningful grouping for the various charts utilized in data visualization.
Overview/Dashboard
This page presents a summary for various Key Performance Indicators (KPIs). For this reason, some charts on the Overview page provide links to permit further exploration of additional data beyond the summarized data.
Such charts include a yellow arrow icon on the bottom right. Clicking the yellow arrow icon would effectively navigate the user to the relevant page that includes the more detailed chart.
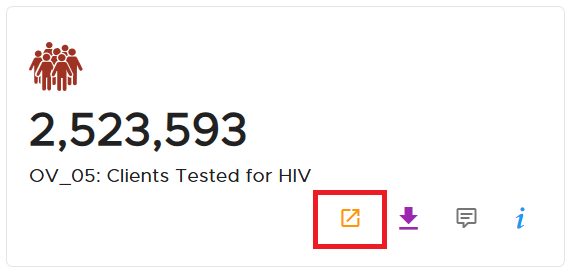
A linkage chart with the linkage icon
HIV Care & Treatment
This page includes charts that visualize data focused on new enrollments for People Living with HIV (PLHIV), ART Initiation Coverage and Census Growth.
Prevention & Testing
Charts on this page visualize data relating to Testing, Linkage, Index Testing, Voluntary Medical Male Circumcision and Condoms.
Quality Care Activities
Data on this page focuses on HIV Test Reviews, Medical Reviews, Time in Motion, Client Satisfaction and Health Facility Assessment.